Loading data
Here, we load an example dataset and then print out some information about it.
Out:
Number of electrodes: 64
Recording time in seconds: [ 5.3984375 14.1328125]
Sample Rate in Hz: [256, 256]
Number of sessions: 2
Date created: Fri Mar  9 17:09:35 2018
Meta data: {'patient': u'CH003'}
# Code source: Lucy Owen & Andrew Heusser
# License: MIT
# import
import supereeg as se
# load example data
bo = se.load('example_data')
# check out the brain object (bo)
bo.info()
# look data, stored as pandas dataframe
bo.data.head()
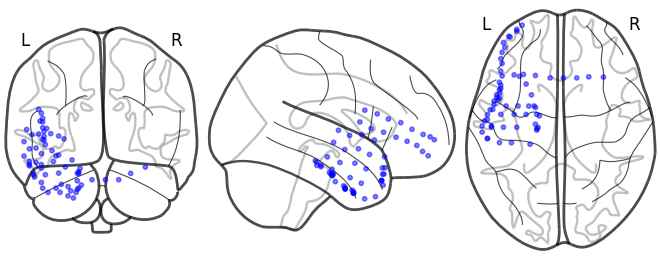
# then can visualize locations
bo.plot_locs()
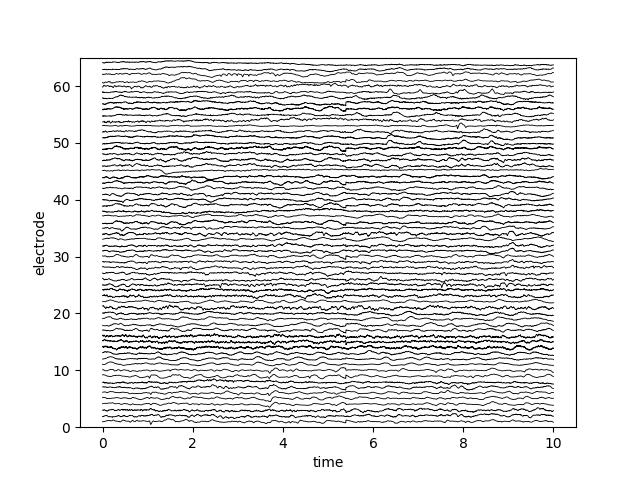
# visualize the data with plot_data
# the default time window is the first 10 seconds, but you can specify your own timewindow
bo.plot_data(time_min=0, time_max=5)
Total running time of the script: ( 0 minutes 0.534 seconds)