Explore labels
In this example, we load in a single subject example, load a model, and predict activity at all model locations. We then plot locations, which are colored labels ‘observed’ and ‘reconstructed’.
# Code source: Lucy Owen & Andrew Heusser
# License: MIT
import supereeg as se
# load example data
bo = se.load('example_data')
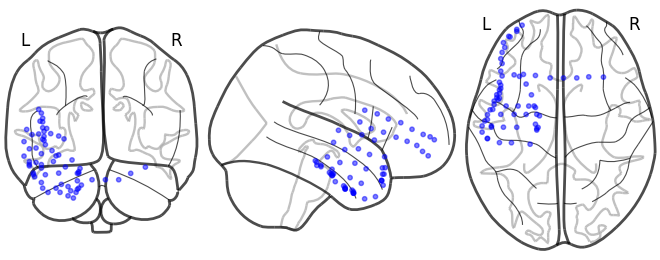
# plot original locations
bo.plot_locs()
# load example model
model = se.load('example_model')
# the default will replace the electrode location with the nearest voxel and reconstruct at all other locations
reconstructed_bo = model.predict(bo, nearest_neighbor=False)
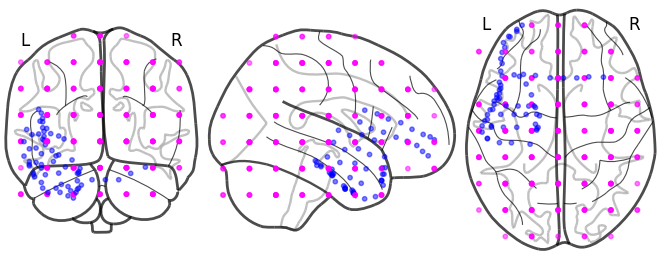
# plot the all reconstructed locations
reconstructed_bo.plot_locs()
Total running time of the script: ( 0 minutes 22.511 seconds)