Load and plot a model
Here we load the example model, and then plot it along with the locations.
# Code source: Lucy Owen & Andrew Heusser
# License: MIT
import supereeg as se
import numpy as np
# load example model
model = se.load('example_model')
# loading older models
num = se.load('example_model', field='numerator')
denom = se.load('example_model', field='denominator')
locs = se.load('example_model', field='locs')
n_subs = se.load('example_model', field='n_subs')
# create new model from old data
new_model = se.Model(data=np.divide(num, denom), locs=locs, n_subs=n_subs)
# these should be the same
assert np.allclose(new_model.get_model(), model.get_model())
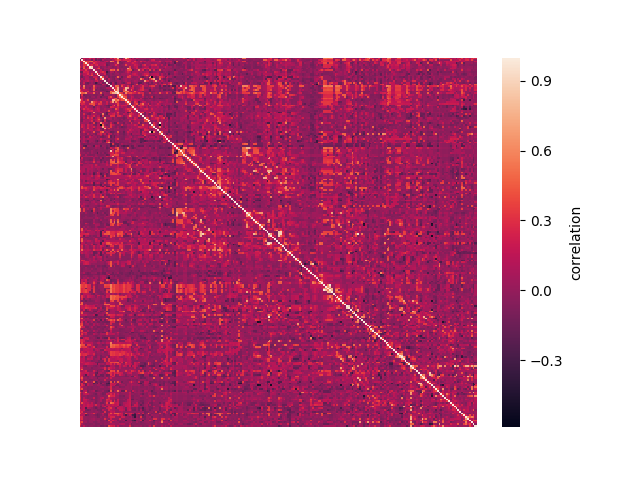
# plot it
model.plot_data(xticklabels=False, yticklabels=False)
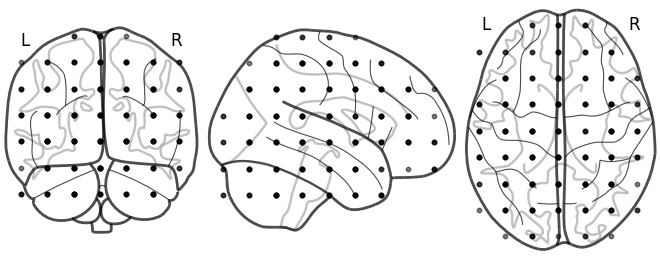
# plot locations
model.plot_locs()
Total running time of the script: ( 0 minutes 0.573 seconds)